I am going to have an internship this summer and we will be making a PowerBI dashboard using data from a live database. Although I have made dashboards in the past, they were usually static data like from a csv file. Luckily, I found this post in YouTube with data I can copy into my own MySQL database: https://www.youtube.com/watch?v=3Acmk-rqn6c&list=PLO9LeSU_vHCWpfLDRTT5nBz9Z0libOs5k . I decided to give it a try and it was actually fun to do.
Project Requirements
We were given a dataset calle pizza_sales.csv that has data from a fictional pizza company and contains information for pizza orders. The data contains the pizza_id, order_id, pizza_name_id, quantity, order_date, order_time, unit_price, total_price, pizza_size, pizza_category, pizza_ingredients, and the pizza_name.
Using these data, we want to calculate the following metrics:
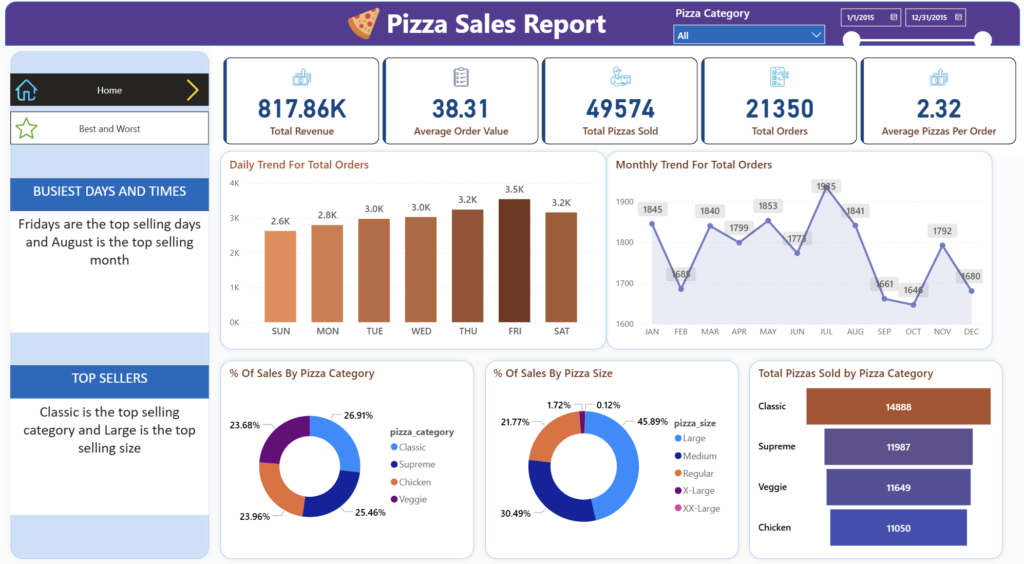
1. Total Revenue: The sum of the total price of all pizza orders.
2. Average Order Value: The average amount spent per order, calculated by dividing the total revenue by the total number of orders.
3. Total Pizzas Sold: The sum of the quantities of all pizzas sold.
4. Total Orders: The total number of orders placed.
5. Average Pizzas Per Order: The average number of pizzas sold per order, calculated by dividing the total number of pizzas sold by the total number of orders.
To understand the key trends, we also want to make the following charts:
1. Daily Trend for Total Orders: Create a bar chart that displays the daily trend of total orders over a specific time period. This chart will help us identify any patterns or fluctuations in order volumes on a daily basis.
2. Monthly Trend for Total Orders: Create a line chart that illustrates the monthly trend of total orders throughout the day. This chart will allow us to identify peak hours or periods of high order activity.
3. Percentage of Sales by Pizza Category: Create a pie chart that shows the distribution of sales across different pizza categories. This chart will provide insights into the popularity of various pizza categories and their contribution to overall sales.
4. Percentage of Sales by Pizza Size: Generate a pie chart that represents the percentage of sales attributed to different pizza sizes. This chart will help us understand customer preferences for pizza sizes and their impact on sales.
5. Total Pizzas Sold by Pizza Category: Create a funnel chart that presents the total number of pizzas sold for each pizza category. This chart will allow us to compare the sales performance of different pizza categories.
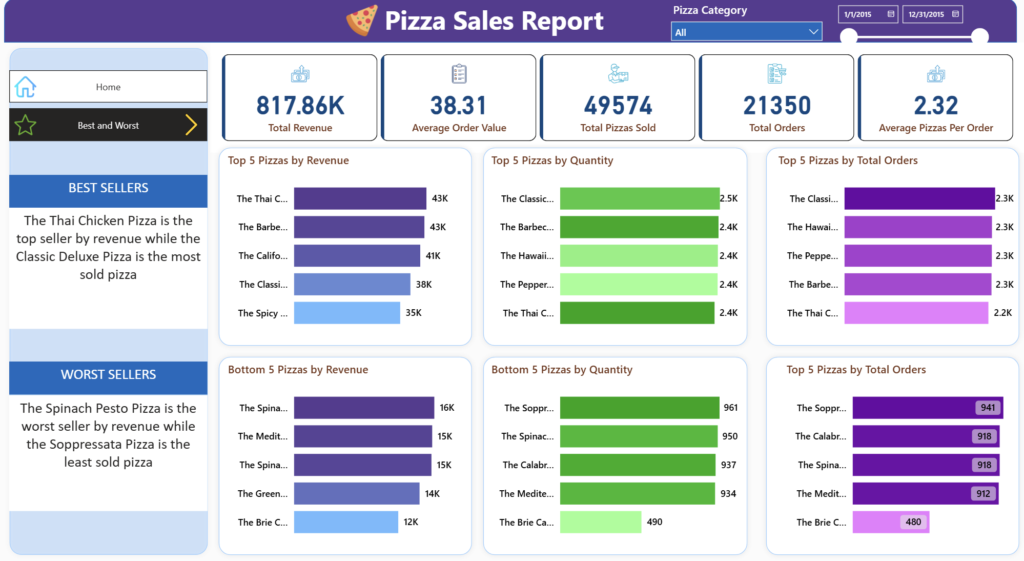
6. Top 5 Best Sellers by Total Pizzas Sold: Create a bar chart highlighting the top 5 best-selling pizzas based on the total number of pizzas sold. This chart will help us identify the most popular pizza options.
7. Bottom 5 Worst Sellers by Total Pizzas Sold: Create a bar chart showcasing the bottom 5 worst-selling pizzas based on the total number of pizzas sold. This chart will enable us to identify underperforming or less popular pizza options.
SQL Queries
We want to create transparency between our platform and our stakeholders so here, we show the SQL queries we used when retrieving the data.
1. Total Revenue: SELECT SUM(total_price) AS Total_Revenue from pizza_sales
2. Average Order Value: SELECT SUM(total_price)/COUNT(DISTINCT order_id) AS Avg_Order_Value from pizza_sales
3. Total Pizzas Sold: SELECT SUM(quantity) AS Total_Pizza_Sold FROM pizza_sales
4. Total Orders: SELECT COUNT( DISTINCT order_id) AS Total_orders from pizza_sales
5. Average Pizzas Per Order: SELECT CAST( CAST(SUM(quantity) AS DECIMAL(10,2) )/ CAST(COUNT(DISTINCT order_id) AS DECIMAL(10,2))AS DECIMAL(10,2))AS Avg_Pizzas_Per_Order from pizza_sales
We also created SQL queries for the data needed in the charts:
1. Daily Trend for Total Orders:
SELECT DAYNAME(order_date) AS order_day, COUNT(DISTINCT order_id) AS Total_orders
FROM pizza_sales
GROUP BY weekday_name
2. Hourly Trend for Total Orders:
SELECT HOUR(order_time) AS order_hours, COUNT(DISTINCT order_id) AS Total_orders
FROM pizza_sales
GROUP BY order_hours
ORDER BY order_hours
3. Percentage of Sales by Pizza Category:
SELECT (SUM(total_price) *100/ (SELECT SUM(total_price) FROM pizza_sales)) AS PCT, pizza_category
FROM pizza_sales
GROUP BY pizza_category
4. Percentage of Sales by Pizza Size:
SELECT CAST((SUM(total_price) *100/ (SELECT SUM(total_price) FROM pizza_sales)) AS DECIMAL(10,2))  AS PCT, pizza_size
FROM pizza_sales
GROUP BY pizza_size
ORDER BY PCT DESC
5. Total Pizzas Sold by Pizza Category:
SELECT pizza_category, sum(quantity) as Total_Pizzas_Sold
from pizza_sales
GROUP BY pizza_category
6. Top 5 Best Sellers by Total Pizzas Sold:
SELECT SUM(quantity) as Total_Pizzas_Sold, pizza_name
FROM pizza_sales
GROUP BY pizza_name
ORDER BY Total_Pizzas_Sold DESC LIMIT 5
7. Bottom 5 Worst Sellers by Total Pizzas Sold:
SELECT SUM(quantity) as Total_Pizzas_Sold, pizza_name
FROM pizza_sales
GROUP BY pizza_name
ORDER BY Total_Pizzas_Sold ASC LIMIT 5
DAX Queries
1. Total Revenue:
Total Revenue = SUM('u103951958_IqkaH pizza_sales'[total_price])
2. Average Order Value:
Average Order Value = [Total Revenue]/[Total Orders]
3. Total Pizzas Sold:
Total Pizzas Sold = SUM('u103951958_IqkaH pizza_sales'[quantity])
4. Total Orders:
Total Orders = DISTINCTCOUNT('u103951958_IqkaH pizza_sales'[order_id])
5. Average Pizzas Per Order:
Average Pizzas Per Order = [Total Pizzas Sold]/[Total Orders]
Dashboard
Here are some screenshots of the dashboard I made.